Presentations are simply a way of life in our line of work. Whether that means a presentation at your team meeting next Wed. Or, a presentation at your industry conference this winter. Or, a presentation to your colleagues about a new trend. Presentations are a key component of how we communicate on a daily basis.
And, to prepare a solid presentation can take an inordinate amount of time and energy. And, in many cases, graphics that tell a story play a large role in said presentations.
Enter infographics, which have come to dominate the online landscape. You seemingly can’t go a few hours without a new infographic popping up on the Web. But, these visuals are popular for a reason. They’re scannable. Easy to look at. And, like I said, they usually (if done right) tell a powerful story.
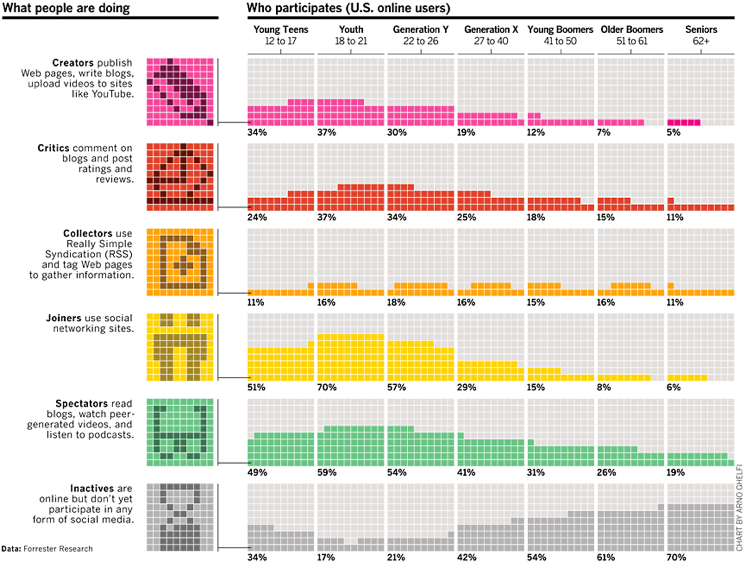
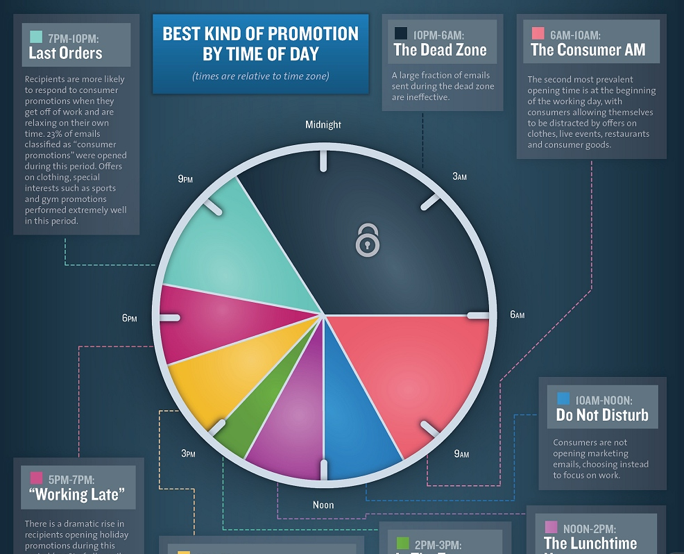
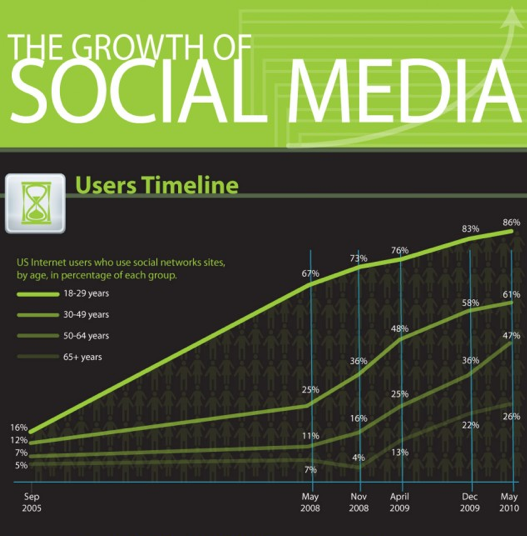
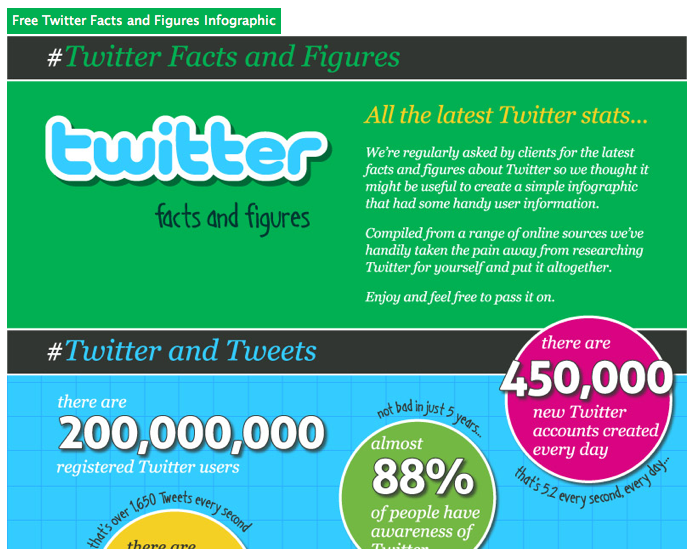
So, I thought I’d share a few infographics that have caught my eye the last number of months. Infographics that would fit nicely in many digital marketing/PR presentations in the months ahead:
The Science of Social Timing: Email marketing
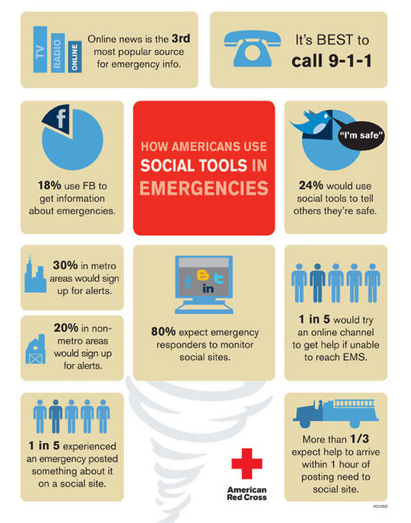
Social media and crisis communications
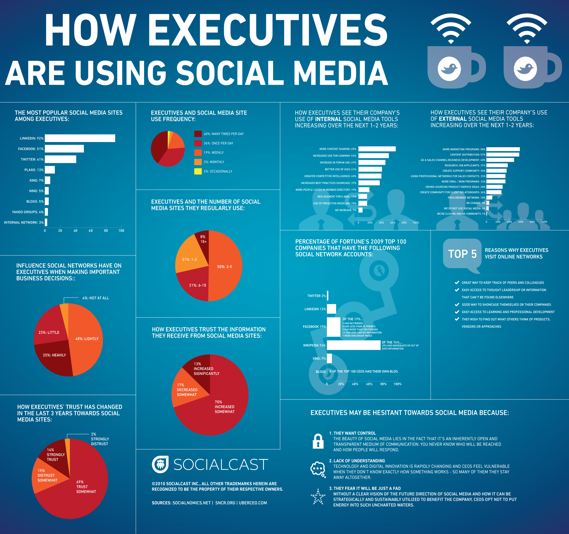
How executives are using social media (this one’s a bit older, but the stats are still relevant; Side note: I’d love to see an updated graphic to see if/how these opinions/perspectives have changed in a year-plus)
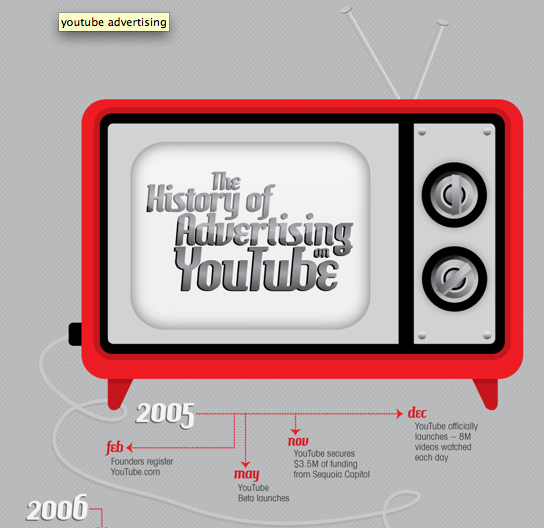
The History of YouTube Advertising
The Daily Deal: A Lasting Sale or Just the Latest Craze


0 Comments